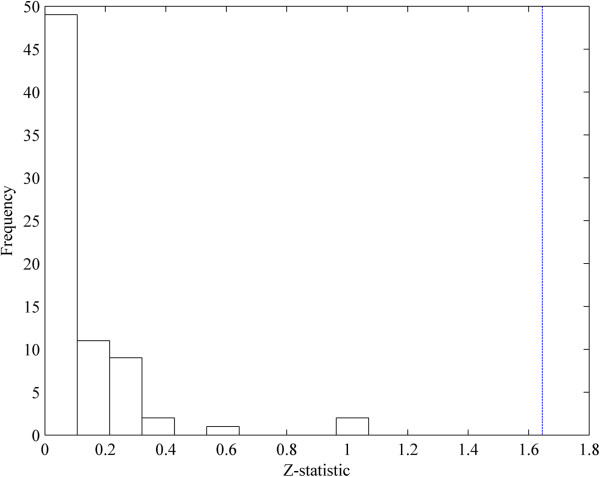
Figure 2.
The significance test for the selected threshold value of the MI and CMI. The x-axis is the Z-statistic values of the deleted edges when the threshold value of MI and CMI is set to be 0.1. The y-axis represents the number of edges whose Z-statistic fall into the corresponding bins. The blue dashed line is the inverse cumulative distribution function of N(0,1) when using significant level α=0.1.

