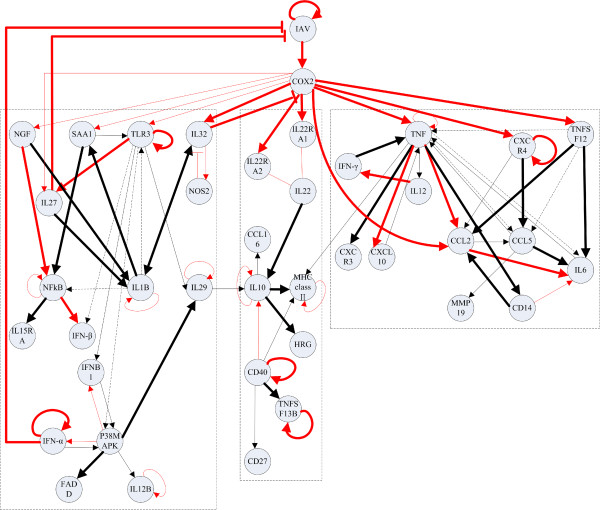
Figure 4.
The optimized inflammatory regulatory network. The lines ended with arrows and bars denote positive and negative regulatory interactions, respectively.The lines without arrows or bars represent binding interactions. The dashed lines indicated the false positive interactions identified by the proposed method. The red and black lines stand for the regulatory interactions which have been validated by biological experiments and are predicted by the proposed method, respectively. The significant and non-significant regulations are denoted by thick and thin lines, respectively.

