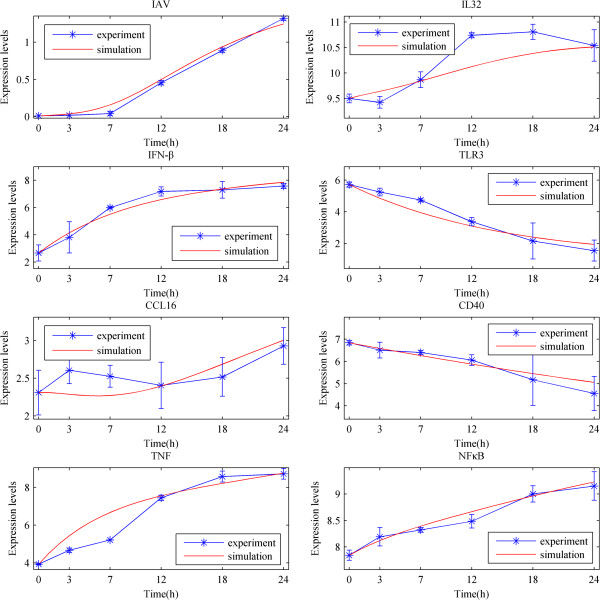
Figure 5.
Comparisons between the numerical simulation results and experimental data of IAV, IL32, IFN-β, TLR3, CCL16, CD40, TNF, NFκB. The blue and red lines denote the experiment and simulation results, respectively. The stars represent experimental data at each time point. The experimental errors are also plotted as short bars at each time point.

