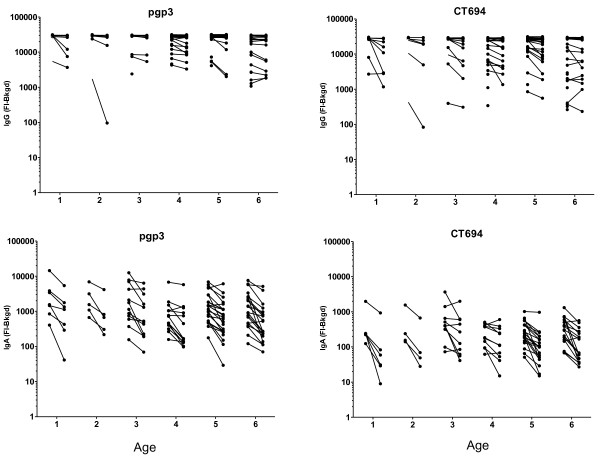
Figure 3.
Difference in individual IgG and IgA responses by age 6 months post-drug treatment. DBS were taken prior to drug treatment with azithromycin and 6 months afterwards. IgG and IgA levels were measured by Luminex multiplex assay and data from paired samples were plotted using GraphPad Prism. Lines connect paired samples from the same individual.

