
Fig. 4.
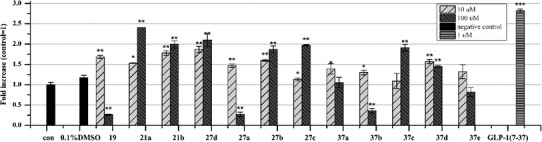
In vitro responses of compounds 19, 21a–21b, 27a–27d, and 37a–37e on CHO-K1 cells at 10 and 100 μM. Experimental details are described in Fig. 3. Vertical and horizontal axes show the fold increases compared to the control and the synthesized compounds, respectively. Values shown are mean ± SD of three independent experiments. Significant difference from 0.1 % DMSO treated group: *p ≤ 0.05, **p ≤ 0.01, and ***p < 0.001