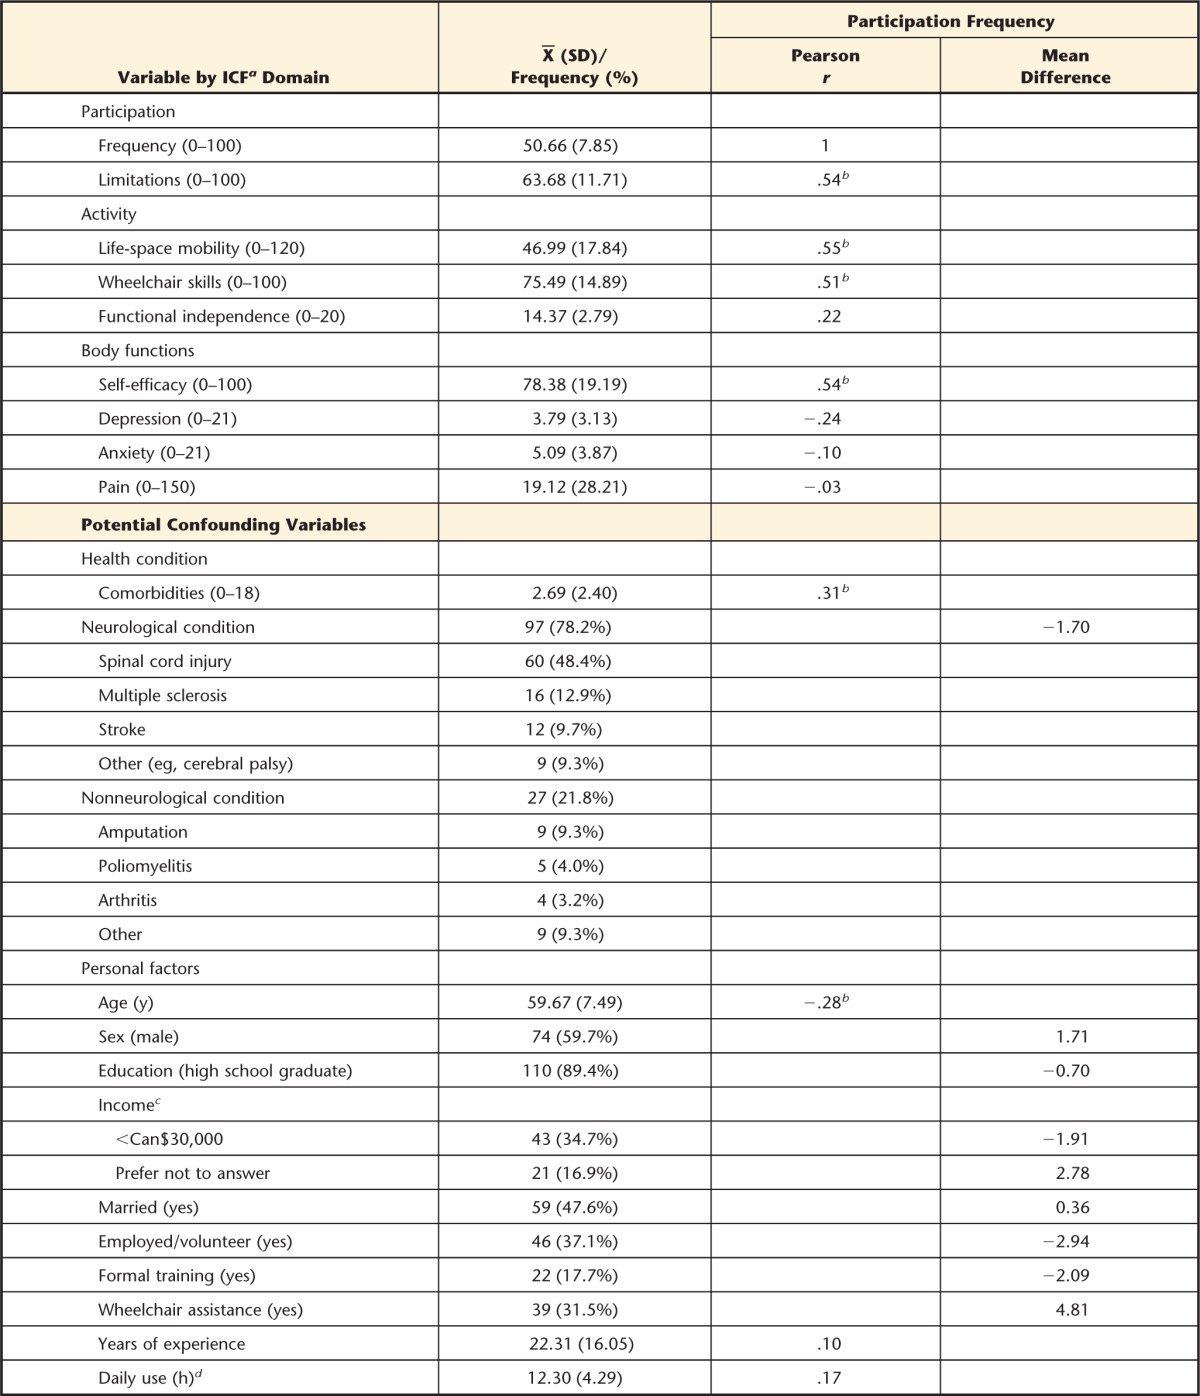
Table 2.
Descriptive Statistics and Correlations With Mean Differences in Participation Frequency (N=124)


a ICF=International Classification of Functioning, Disability and Health.
b Included for modeling.
c Mean difference from ≥30,000.
d n=123.
Descriptive Statistics and Correlations With Mean Differences in Participation Frequency (N=124)


a ICF=International Classification of Functioning, Disability and Health.
b Included for modeling.
c Mean difference from ≥30,000.
d n=123.