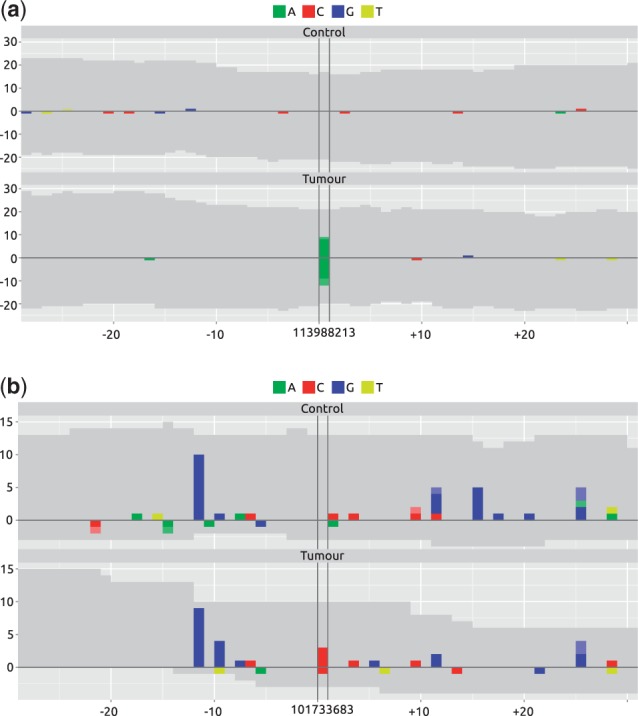
Fig. 1.

mismatchPlots of two candidate variant sites. Each sample (Control, Tumor) is shown in a separate panel, with the genomic position as a common x-axis centered around the position of the variant. Along the y-axis, alignment statistics of the forward and reverse strand are shown as positive and negative values, respectively. Gray areas represent coverage by sequences matching the reference, and colored areas represent mismatches, deletions and insertions. (a) Variant is present in the tumor sample but not in the control. (b) Variant of comparable position specific statistics as (a). Note the noisiness of the region, which is not immediately obvious from the position-specific values alone
