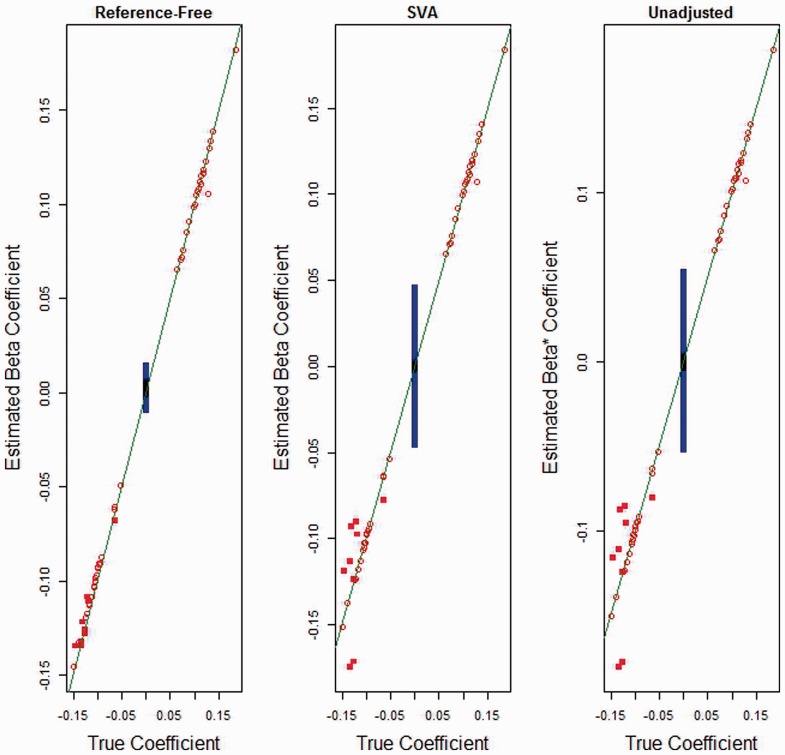
Fig. 1.
Simulation 1: estimated effect by true effect. Comparison of slope estimates: true direct effect ( ) versus its estimate (
 ), true direct effect versus the SVA-adjusted estimate and true direct effect (
 ) versus the unadjusted effect (
 ). Squares indicate DMRs. Red indicates non-null CpGs. Black squares represent non-null DMRs

