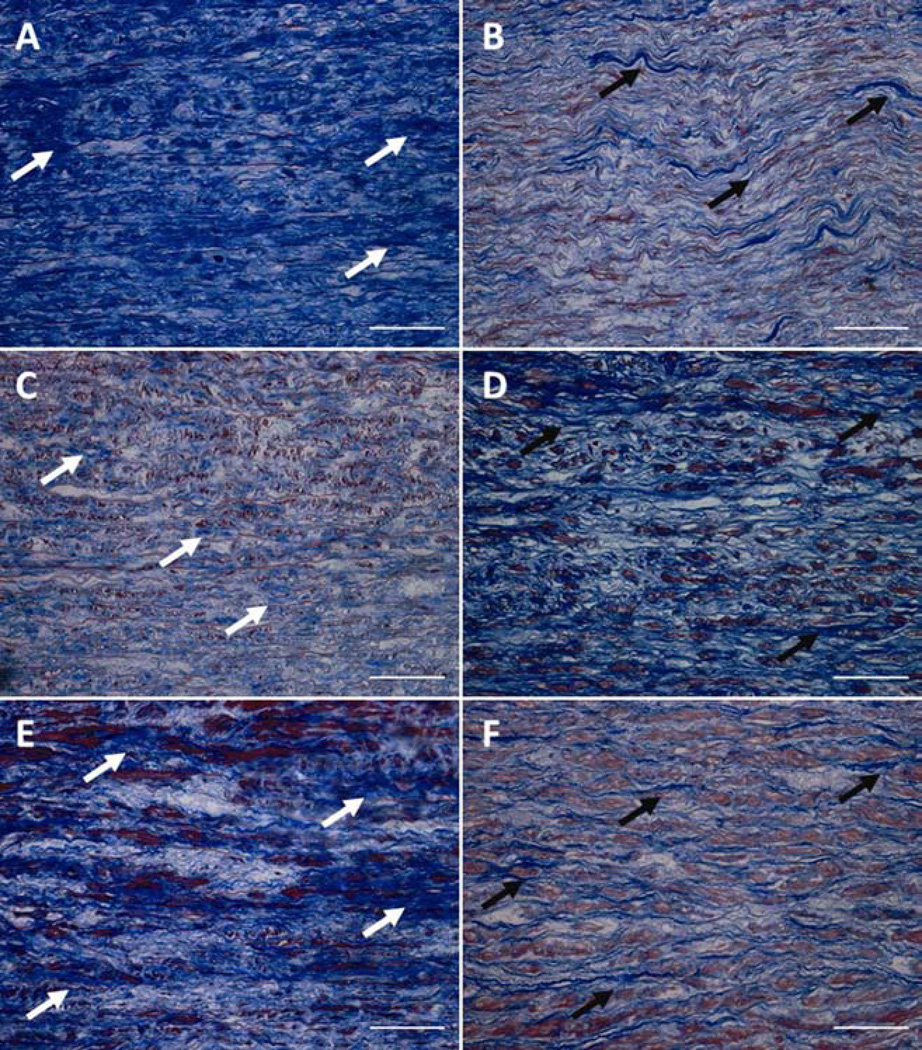
Figure 4.
Three representative micrographs of Masson’s trichrome staining of BAV (A, C, E) and TAV (B, D, F) tissues. Note that BAV shows more disrupted collagen (blue color, white arrows). TAV has less collagen (blue color, black arrows), but aligned in orientation. Scale bar= 50 µm. BAV=bicuspid aortic valve; TAV=tricuspid aortic valve.

