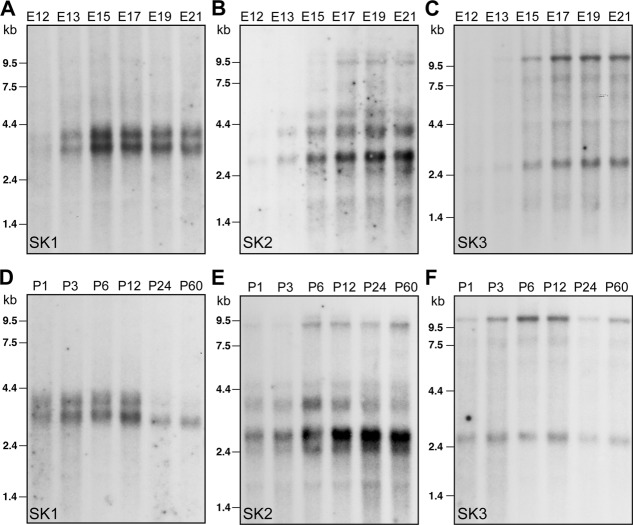
Figure 1.
Northern blots displaying SK channel subunit transcripts at different stages of embryonic (A–C) and postnatal (D–F) development. Two bands 3.2 kb and 4.0 kb in length were observed for SK1 (A,D), two main bands of 2.8 kb and 3.6 kb for SK2 (B,E) and two bands of 2.6 kb and 10 kb for SK3 (C,F).

