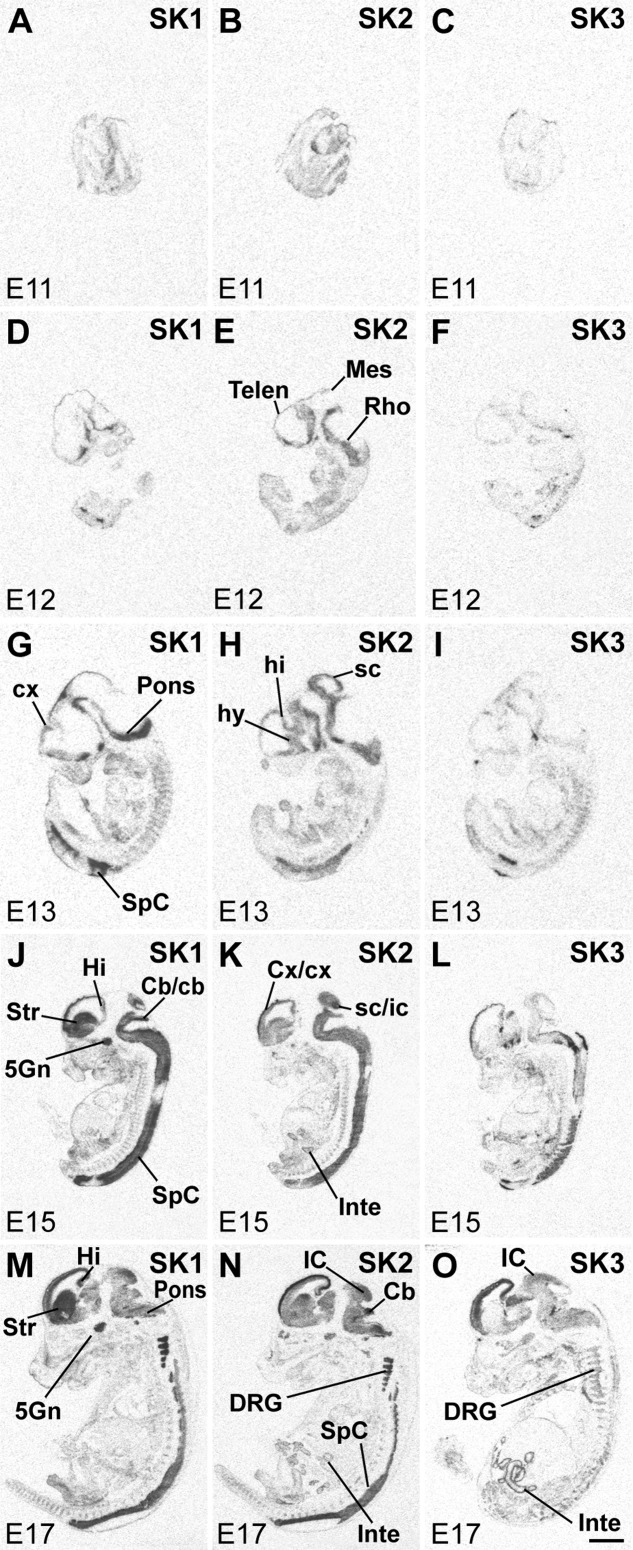
Figure 2.

SK subunit mRNA expression in rat embryos (E11: A–C; E12: D–F; E13: G–I; E15: J–L; and E17: M–O). X-ray film images of sections hybridized with oligonucleotide probes specific for SK1 (left column), SK2 (middle column) and SK3 (right column) show distribution of transcripts in the CNS and the body. Dark areas contain high levels of mRNA. For abbreviations see list. Abbreviations are according to Paxinos et al. (1994) and Paxinos and Watson (1998). Scale bar = 2 mm.
