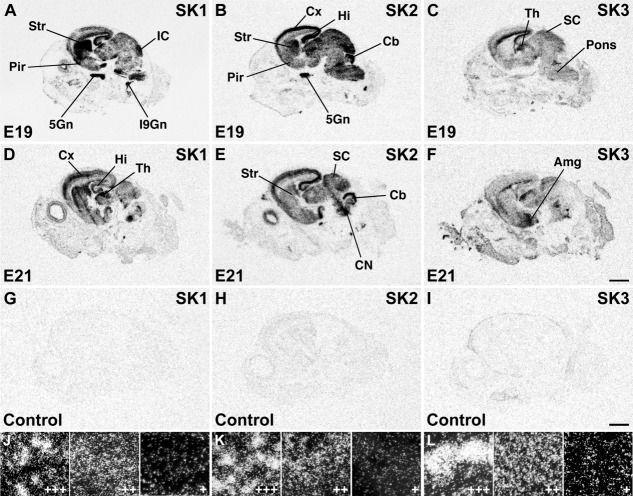
Figure 3.
X-ray images of sagittal sections of rat heads at E19 (A–C) and E21 (D–F) show largely overlapping distribution of SK1 and SK2 transcripts in several cortical and subcortical areas, whereas SK3 mRNA has a complementary distribution pattern. Control sections at E21 (G–I) hybridized in the presence of 100-fold excess cold oligonucleotide for each probe show a uniformly low, nonspecific labeling. Darkfield photomicrographs from various brain regions at E19–E21 exemplifying signals of strong (+++), moderate (++), and weak (+) intensity for SK1 (J), SK2 (K), and SK3 (L). For abbreviations see list. Scale bars = 2 mm in F (applies to A–F); 2 mm in I (applies to G–I).

