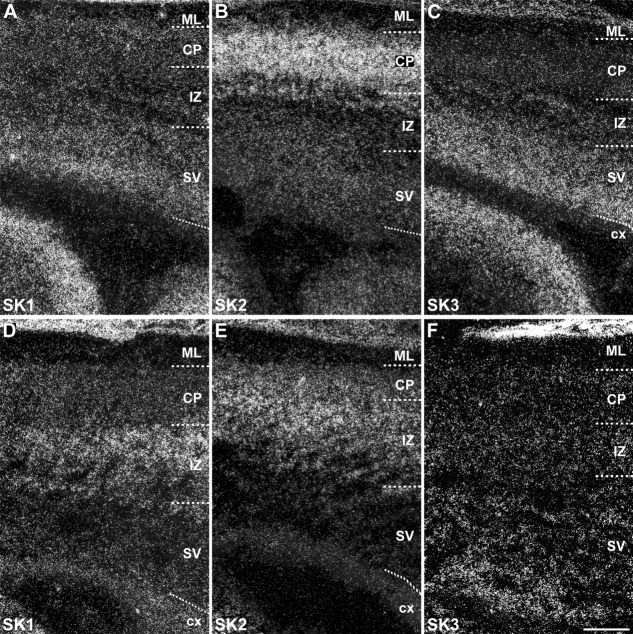
Figure 9.
Distribution of SK1, SK2, and SK3 subunit transcripts in the immature embryonic neocortex showing changes in the distribution of the three subunits in the transition from stage E19 (A–C) to E21 (D–F). In particular, SK1 (A,D) decreases in the subventricular zone (SV) and increases in the intermediate zone (IZ); SK2 (B,E) displays a similar decrease of expression in the subventricular zone but also in the cortical plate (CP), accompanied by an increase in the intermediate zone; finally, SK3 shows a decreased expression in the subventricular zone at E21 (C,F). For abbreviations see list. For details on the distribution see Tables3. Scale bar = 200 μm.

