Figure 12.

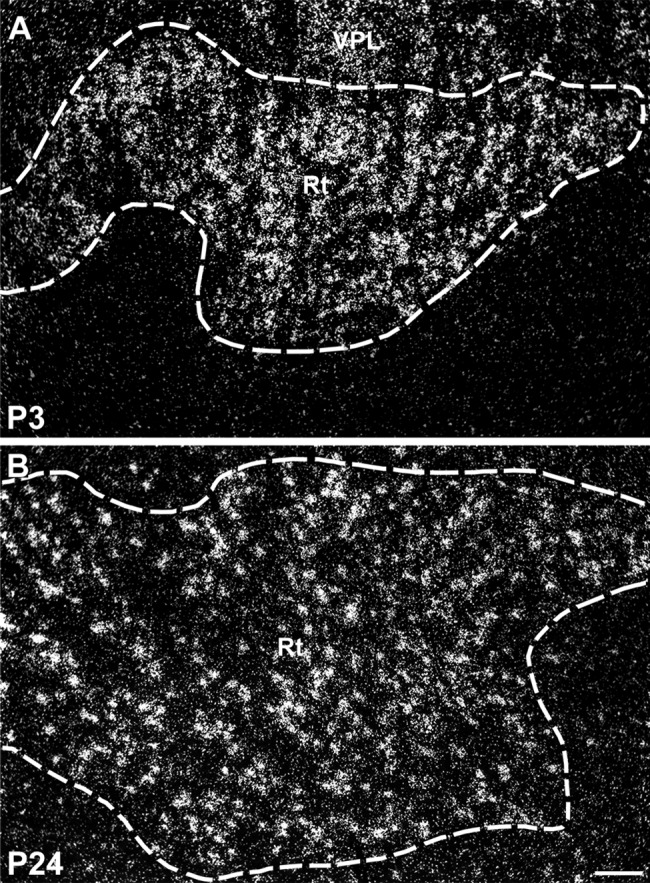
Darkfield photomicrographs showing strong expression of SK2 transcripts in the reticular thalamic nucleus (Rt) at P3 (A) and P24 (B). For abbreviations see list. Scale bar = 100 μm.

Darkfield photomicrographs showing strong expression of SK2 transcripts in the reticular thalamic nucleus (Rt) at P3 (A) and P24 (B). For abbreviations see list. Scale bar = 100 μm.