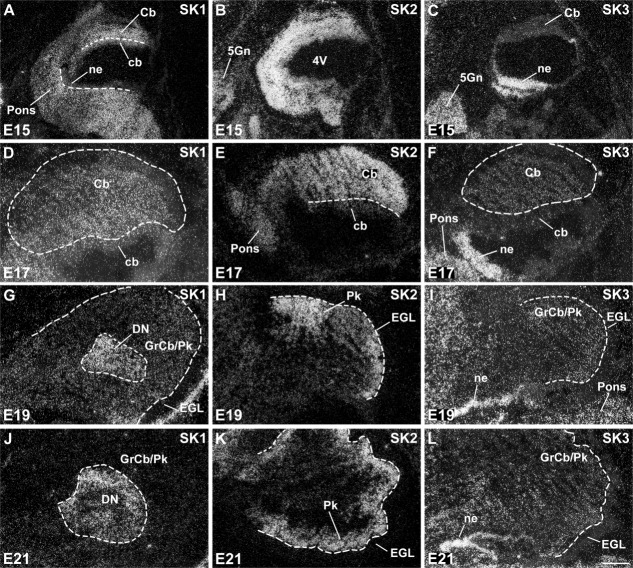
Figure 13.
Expression of SK1, SK2, and SK3 in the embryonic differentiating cerebellum and precerebellar nuclei. SK1 displays a diffuse expression pattern in the cerebellar differentiating field (Cb) at E15 (A) and E17 (D), with strong expression predominantly in the deep cerebellar nuclei (DN) at E19 (G) and E21 (J). SK2 is expressed more strongly than SK1 in the cerebellar differentiating field at E15 (B) and E17 (E). Its strongest expression is subsequently observed in the differentiating Purkinje cell layer (Pk) at E19 (H) and E21 (K). SK3 shows an overall weak and diffuse expression in the cerebellar differentiating field from E15 (C) to E21 (L), in contrast to strong expression in the precerebellar (C,F) and cochlear (I,L) neuroepithelia. For abbreviations see list. For details on the distribution see Tables3. Scale bars = 400 μm in L (applies to D–J,L); 800 μm for A,B,C,K.

