Figure 14.

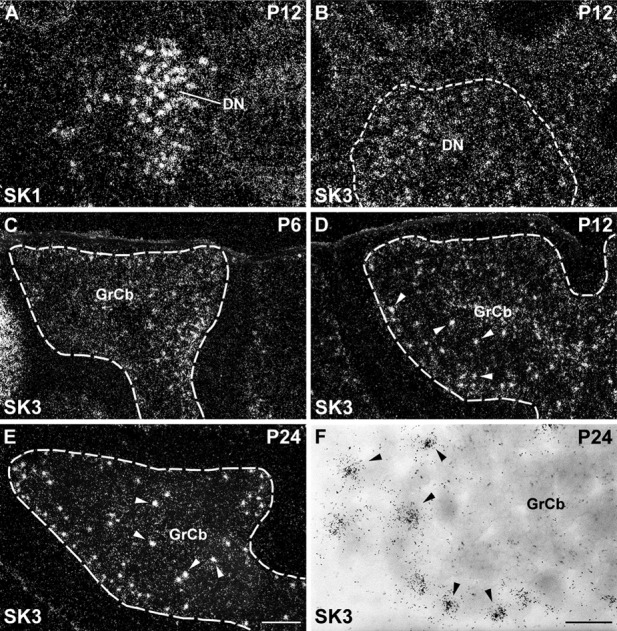
Expression of SK1 and SK3 subunits in the postnatal cerebellum. SK1 shows strong expression in large neurons of the deep cerebellar nuclei (DN) at P12 (A). SK3 is also expressed at moderate levels in the deep nuclei at P12 (B). C–E: Darkfield photomicrographs displaying strong signal for the expression of SK3 transcripts in scattered Golgi cells at P6 (C), P12 (D), and P24 (E). Golgi cells are depicted at higher magnification in F, using brightfield optics that reveal clear clusters of silver grains on scattered cell nuclei (arrowheads). For abbreviations see list. For details on the distribution see Tables4 and 6. Scale bars = 300 μm in E (applies to A–E); 40 μm in F.
