Figure 1.

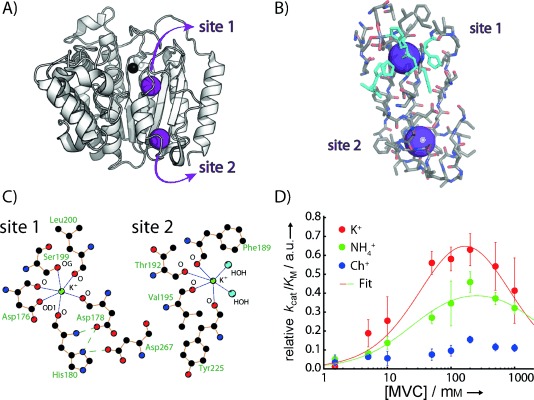
A) Crystal structure of HDAC8 (PDB ID: 2V5W) with the active-site Zn2+ (black sphere) and the two K+ ions (purple spheres). B) Residues within approximately 10 Å of the two potassium binding sites in HDAC8. Histidine residues are shown in cyan. C) Two-dimensional representations of the two binding sites (generated with Ligplot).[12] K+-coordinating residues and atoms are labelled. D) Activity profile as a function of monovalent cation concentration. Concentrations of K+ (red), NH4+ (green) and choline+ (blue) were in 25 mm Tris⋅HCl at pH 8.0. The two-site binding model described previously[5] was used to fit the activity profile for KCl and NH4Cl according to the equation v=v1/(1+K1/2,act/[MVC]+[MVC]/K1/2,inh), where K1/2,act and K1/2,inh are the apparent binding affinities (dissociation constants) for activation and inhibition, v is the relative kcat/KM value, v1 is the kcat/KM value of the fully activated state and [MVC] is the concentration of the respective monovalent cation. kcat/KM of the fully inhibited state was set as zero; data are normalised such that v1 (K+)=1.0. K1/2,act (K+): 45±26 mm, K1/2,inh (K+): 610±530 mm, K1/2,act (NH4+): 25±8 mm, K1/2,inh (NH4+): 2600±1700 mm. Although the errors for the affinities of the inhibitory site are large, these data agree with a bell-shaped activity profile for K+ and NH4+.
