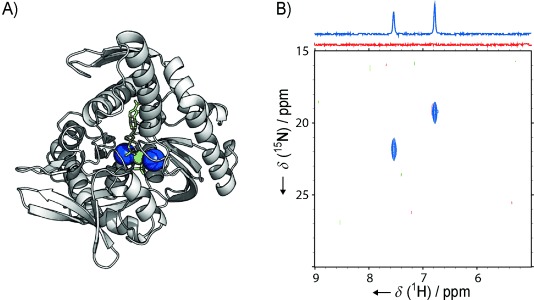
Figure 3.

A) Crystal structure of the ATPase domain of Hsp70 (PDB ID: 1HPM):[2] purple spheres: K+, green sphere: Mg2+, yellow sticks: ADP and Pi. A Ligplot analysis showing two-dimensional representations of the binding sites is shown in Figure S2. B) 1H,15N HSQC spectra and 1D projections (above) with the ABD of bacterial Hsp70 homologue DnaK. Red spectra: DnaK-ABD (100 μm) in 30 mm Tris⋅HCl, 150 mm 15NH4Cl, 5 mm MgCl2 and 1 mm DTT, pH 7.5. Blue spectra: the same sample after addition of 0.5 mm ADP and 50 mm 14NH4H2PO4. Note: because of the low pH of the 14NH4H2PO4 stock solution, Tris base was also added to achieve pH 7.5, thus increasing the total Tris concentration to 75 mm.
