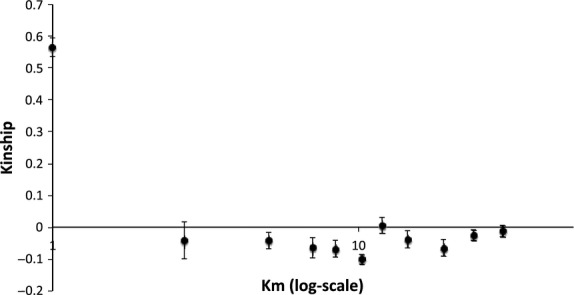
Figure 2.

Kinship plotted against distance with standard error bars. The first point represents within-infestation kinship, the following 10 points represent geographical distance intervals, chosen in Spagedi such that each interval contains an equal number of comparisons.
