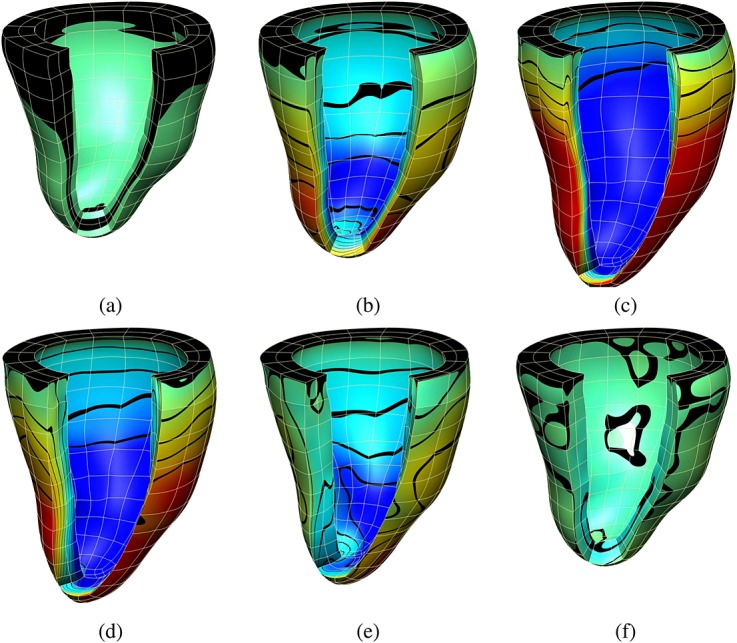
Figure 5.

(a), (b), and (c) show the displacement values in the fiber direction at three time steps during diastole; (d), (e), and (f) at three time steps during systole. Displacement values are represented by a color map from dark blue ( − 5.0) to red (5.9) and contour bands.
