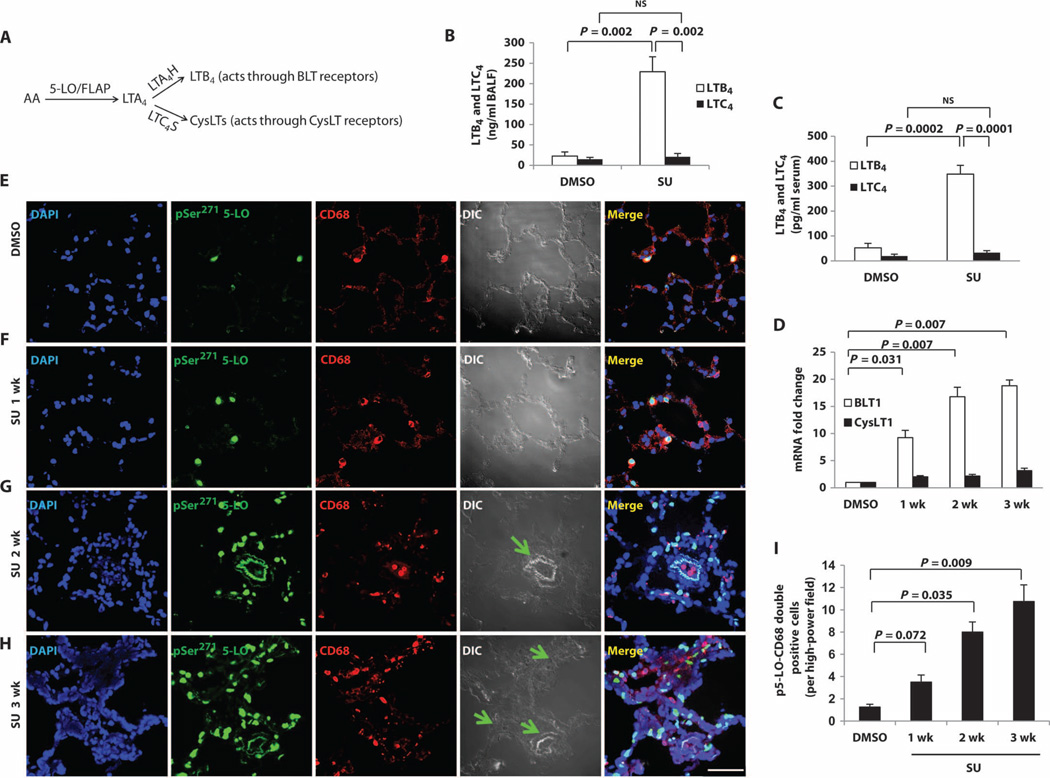
Fig. 1. Increased macrophage LTB4 biosynthesis during evolution of experimental PH.
(A) Summary of the LT pathways. (B and C) LTB4 and LTC4 concentrations in (B) BALF and (C) serum from dimethyl sulfoxide (DMSO)–treated (vehicle control) and SU-treated (PAH: 3 weeks after SU administration) animals with experimental PH as measured by liquid chromatography–tandem mass spectrometry (LC-MS/MS). (D) BLT1 (major LTB4 receptor) and CysLT1 (major CysLT receptor) mRNA levels measured by reverse transcription polymerase chain reaction (RT-PCR). (E to H) Representative immunofluorescence images from lung sections stained with p5-LO (green) and CD68 (red) from (E) DMSO, (F) 1week after SU, (G) 2 weeks after SU, and (H) 3 weeks after SU. 4′,6-Diamidino-2-phenylindole (DAPI) (blue) identifies nuclei. Differential interference contrast (DIC) highlights alveolar and vascular structures. Green arrows point to the center of occluded arterioles. Merged panels show all three stains. (I) Quantitation of the data in (E) to (H) (expressed as p5-LO+ macrophages per high-power field). n = 6 per group. Scale bar, 50 µm. Kruskal-Wallis test followed by Dunn’s multiple comparisons test for post hoc analyses was used. Data are means ± SEM. NS, not significant.

