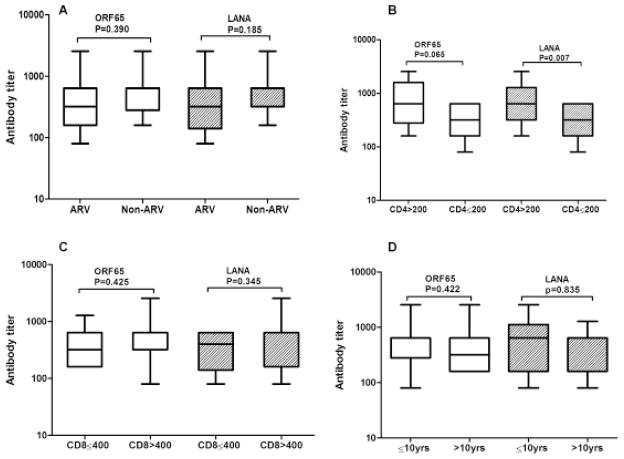
Figure 1. Box-and-whisker plots of HHV8 lytic and latent antibody titer by HIV-related factors.
(A) Antibody titer for patients receiving ART and not receiving ART. (B) Antibody titer for patients with CD4 ≤ 200 cells/mm3 and CD4 > 200 cells/mm3. (C) Antibody titer for patients with CD8 ≤ 400 cells/mm3 and CD8 > 400 cells/mm3. (D) Antibody titer for patients infected with HIV ≤ 10 yr and those infected with HIV > 10 yr. Titers for different groups were calculated and compared using Mann-Whitney U. “yr” stands for years.

