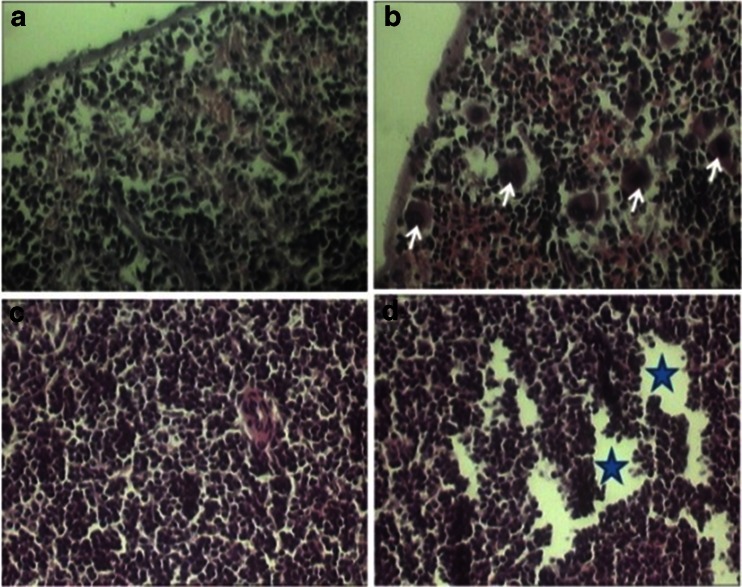
Fig. 1.
Spleen transverse sections of the control (a, c) and 320 mg/kg phenol treated (b, d) animals. The b section shows abundant megakaryocytes (arrows) infiltration in the whole parenchyma of the spleen in the phenol-treated mice. The d section shows severe depletion (star area) of the different lymphoid cells in the whole parenchyma of the spleen in the phenol-treated mice (hematoxylin and eosin stain; a–d ×400)

