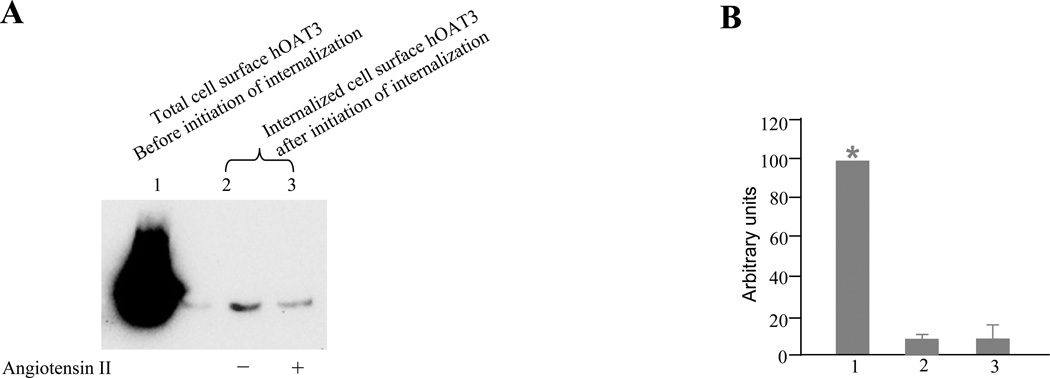
Figure 7. Biotinylation analysis of constitutive and angiotensin II-modulated Na/K-ATPase internalization.
A. Na/K-ATPase internalization (10 min) was analyzed as described in “materials and methods” section in cell treated with or without angiotensin II (1 μM) followed by western blotting using anti-Na/K-ATPase antibody (1:500). “+”: in the presence of angiotensin II. “−“: in the absence of angiotensin II. B. Densitometry plot of results from Fig. 7a. Internalized Na/K-ATPase was expressed as % of total initial cell surface Na/K-ATPase pool. Values are mean ± S.D. (n = 3). *P < 0.05, significantly different from the amount of hOAT3 internalization in the absence of angiotensin II.

