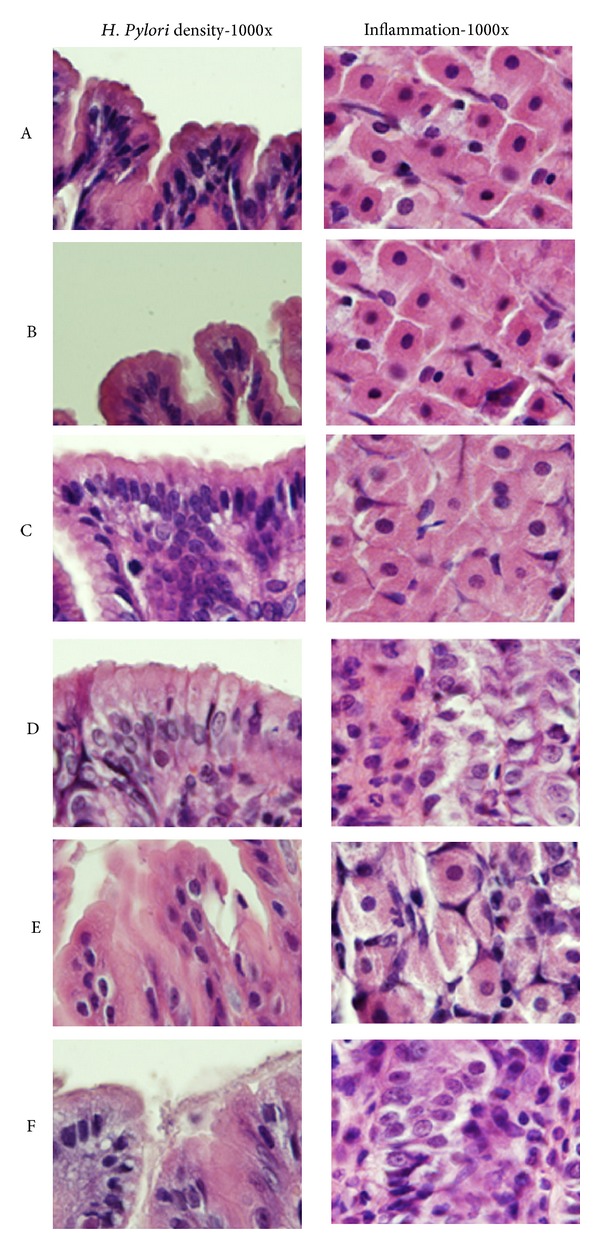
Figure 6.

Histological changes of different groups are shown (H&E stain 1000x). We show the status of H. pylori density in right field and the status of inflammation in left field. There is no obvious inflammatory cells infiltration in groups A, B, and C, but obvious inflammatory cells infiltration was noted in groups D, E, and F. The densities of H. pylori were higher in group F.
