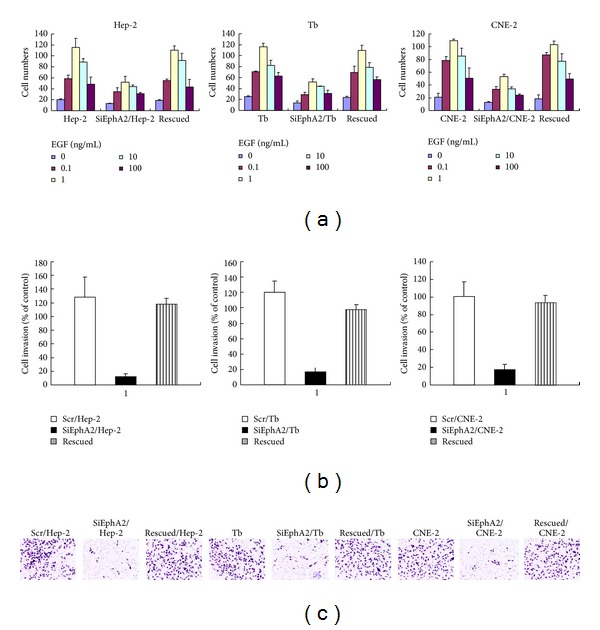
Figure 4.

Chemotaxis and invasion assays in HNSCC cell lines. (a) SiEphA2/HNSCC cells, scr/HNSCC cells, and rescued cells induced by EGF appeared in a dose-dependent manner, although the chemotaxis of the siEphA2/HNSCC cells was impaired in response to EphA2 reduction. Chemotaxis assays showed that 1 ng/mL EGF was the optimization concentration for transwell. (b) Invasion assays. There was a remarkably reduced invasion in HNSCC cell lines compared with the control cells and rescued cells (P < 0.05).
