
Figure 1.
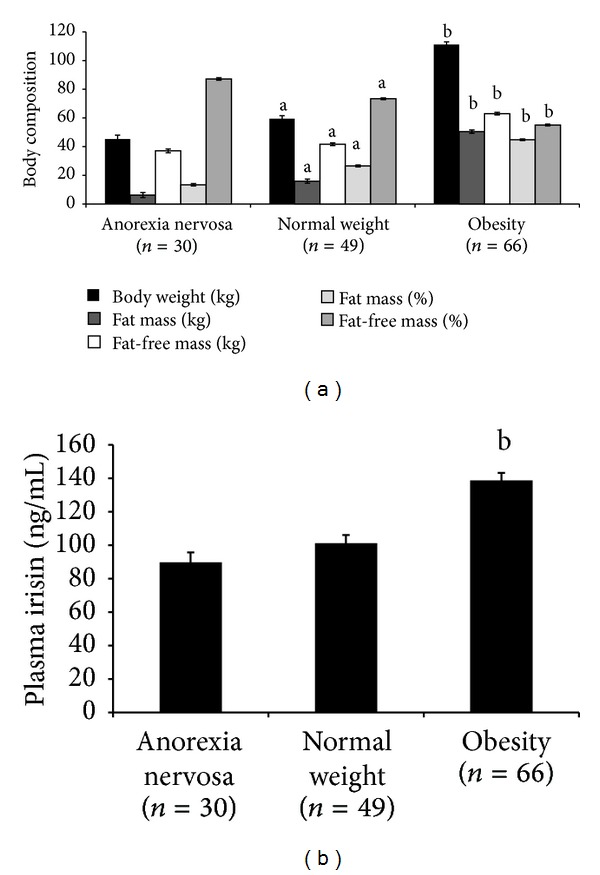
Body composition and plasma irisin circulating levels. Body weight (kg), fat mass (kg), fat-free mass (kg), fat mass (%), and fat-free mass (%) are shown in the anorexia nervosa, normal weight, and obese groups. (a) Plasma irisin concentration in the three experimental groups (b). The data are shown as the mean (SE). Statistically significant differences are denoted as (a) P < 0.001 versus anorexia nervosa and (b) P < 0.001 versus normal weight and anorexia nervosa.