
Figure 3.
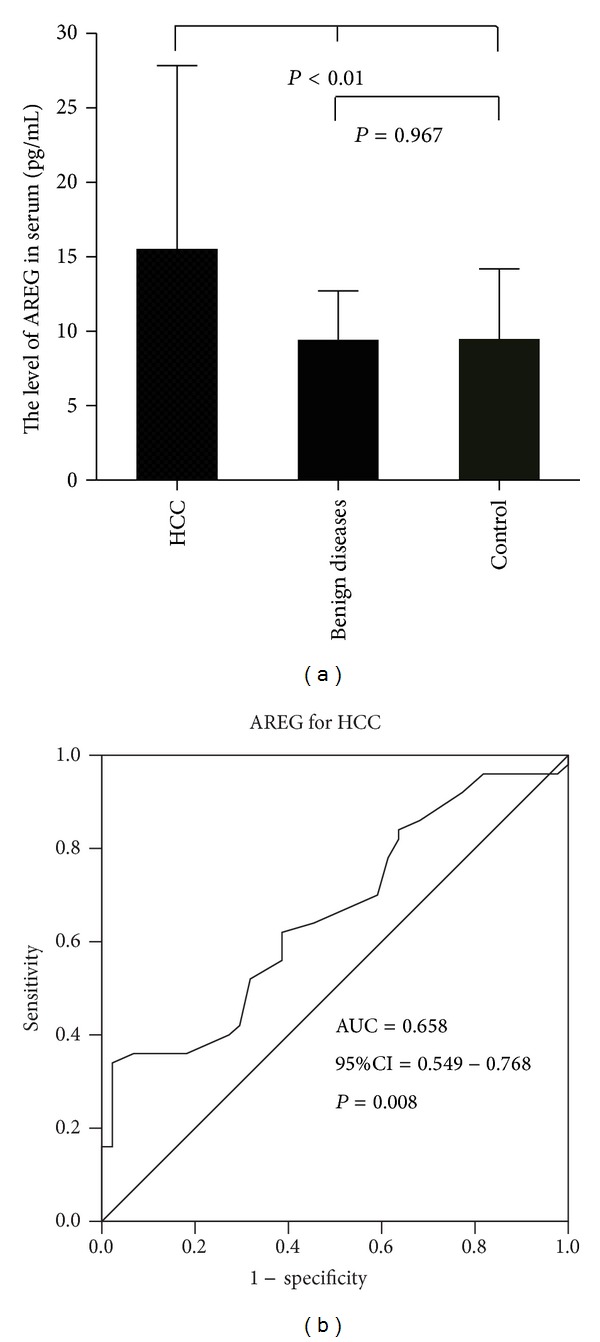
(a) showed the levels of serum AREG among normal controls, benign liver disease, and HCC patients. Mean levels of serum AREG and Std. Deviation is illustrated by bar charts; (b) showed the ROC curves of serum AREG between normal controls and HCC patients.