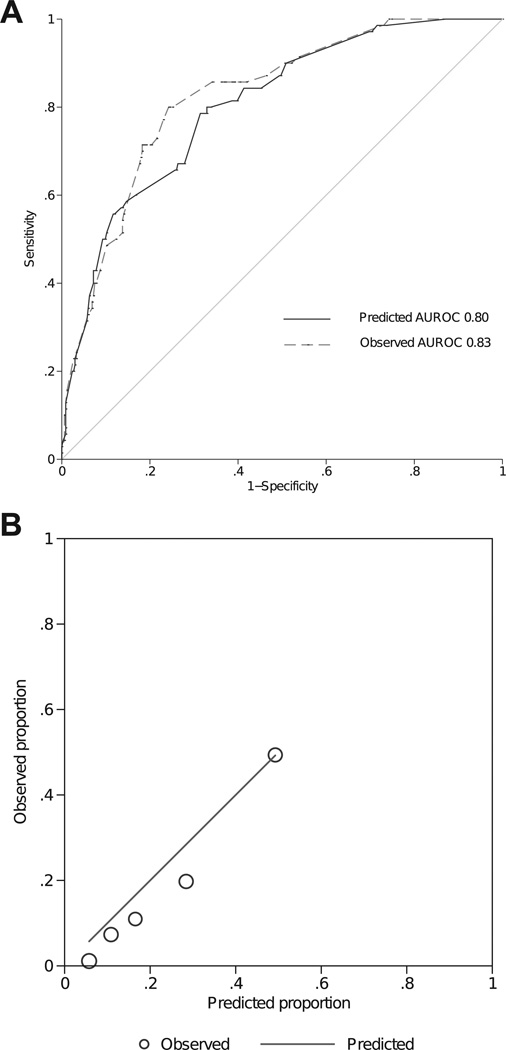
Figure 2.
A, The receiver operating characteristics (ROC) curve of discriminating people who adhered versus who didn’t in the validation cohort (Automated Dosing Reminder Study [ADRS]). The area under the ROC (AUROC) is 0.80 (95% confidence interval, 0.75– 0.86) for the Travatan Dosing Aid Study (TDA)–derived model and 0.83 (95% confidence interval, 0.78–0.88) for the ADRS-derived model (P = 0.078 between the 2 curves). B, Comparison of predicted versus observed nonadherent rate for the TDA-derived model in the validation cohort (ADRS). Each circle represents a quantile of predicted risk. The Hosmer-Lemeshow goodness-of-fit statistic is 9.91 (P = 0.102).

