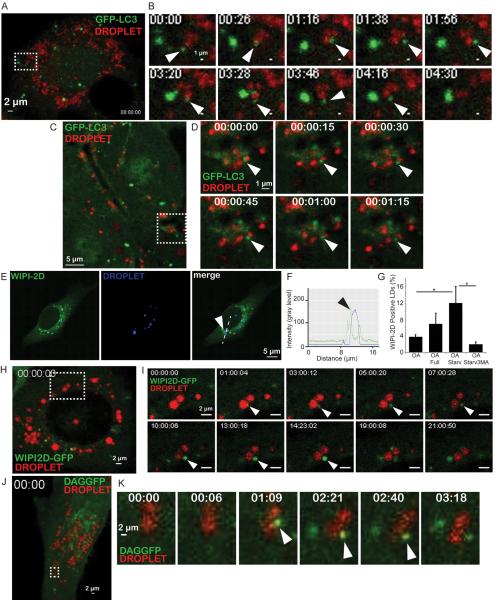
Figure. 2. Imaging analysis of dynamic interactions between lipid droplets and LC3, WIPI2D and a diacylglycerol GFP probes.
(A,B) Still frames from time lapse imaging of GFP-LC3 expressing HeLa cells (Movie S1). HeLa cells expressing GFP-LC3 (green) treated for 20 h with 500 μM OA (BSA-oleic acid), LDs (red) labeled with LipidTox Farred, and live imaging initiated in starvation (EBSS) medium. Time, min:sec. Rectangle in A, area in time-lapse still frames in B. Arrowheads, a GFP-LC3 positive structure (green) interacting with a lipid droplet (red). (C,D) Still frames from intravital imaging of intact liver from GFP-LC3 mice (Movie S2). Time, h:min:sec.. Arrowheads, a GFP-LC3 positive structure (green) interacting with a lipid droplet (red). (E–G) Confocal microscopy analysis of U2OS cells stably expressing GFP WIPI-2D. Lipid droplets were visualized (blue channel) with LipidTox DeepRed. Cells were treated as in A, starved for 2 h and then fixed. Arrowheads, recruitment of WIPI2D to lipid droplets. (F) Two-fluorescence channel line tracings corresponding to dashed lines in images to the left. (G) WIPI-2D positive LDs were quantified by Image J. Cells were pre-treated for 20 h with 500 μM BSA-oleic acid (OA) then starved (OA Starv) or not (OA Full) for 2 h in the absence or presence of 3-MA treatment (OA Starv3MA). Data means ± s.e. (n≥3); *, p<0.05. (H,I) Still frames from live imaging of U2OS cells stably expressing GFP-WIPI2D (Movies S3 and S4). Cells were treated as in A. Time, h:min:sec. Rectangle in H, area in still frames in I. Arrowheads, an emerging GFP-WIPI2D positive (green) structure juxtaposed to an LD, enlarging in size with time. (J,K) Still frames from live imaging of GFP-DAG expressing HeLa cells (Movies S5 and S6). HeLa cells expressing NES-GFP-DAG (green) were treated as in A. Time, min:sec. Rectangle in J, still frames in K. Arrowheads, a GFP-DAG positive (green) structure emerging juxtaposed to LD.

