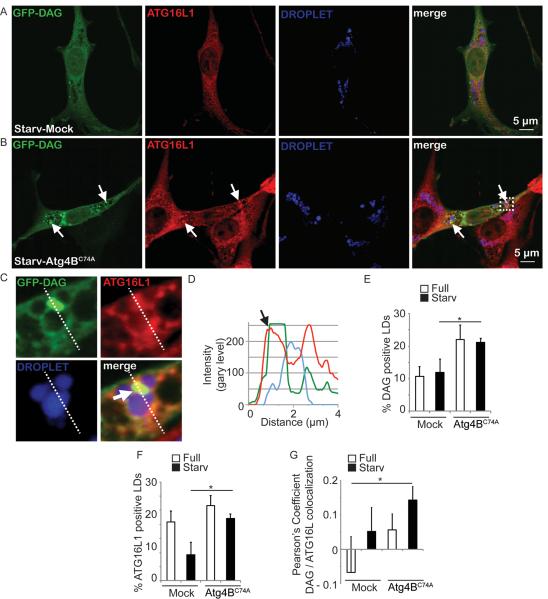
Figure. 6. Localization analysis of DAG and ATG16L1 juxtaposed to lipid droplets upon overexpression of mutant ATG4BC74A.
(A–G) Diacylglycerol (DAG, green; revealed by the NES-GFP-DAG probe) and ATG16L1 (red) relative to lipid droplets (LD, blue). 3T3 cells expressing ATG4B (A; Mock) or ATG4BC74A (B) proteins were transfected with a plasmid expressing NES-GFP-DAG, treated for 20 h with 500 μM BSA-Oleic Acid, and starved in EBSS for 150 minutes. ATG16L1, immunostatining. Arrows, overlap between ATG16L1 and DAG signals juxtaposed to LD. (C,D) Enlarged area (dashed box in B) and fluorescence line tracings. (E) Quantification of the recruitment of GFP-DAG probe to LDs. DAG positive LDs were quantified by using SlideBook morphometric analysis software (details in Materials and Methods). 3T3 cells expressing ATG4B (Mock) or ATG4BC74A proteins were processed as in A. (F). ATG16L1 positive LDs were quantified using SlideBook morphometric analysis software in 3T3 cells expressing ATG4B (Mock) or ATG4BC74A processed as in A and B. Data, means ± s.e. (n≥3); *, p<0.05. (G) Pearson's coefficients for DAG and Atg16L1 surrounding the droplets (SlideBook morphometry; 3 independent experiments with 5 fields per experiment). Data, means ± s.e. (n≥3); *, p<0.05

