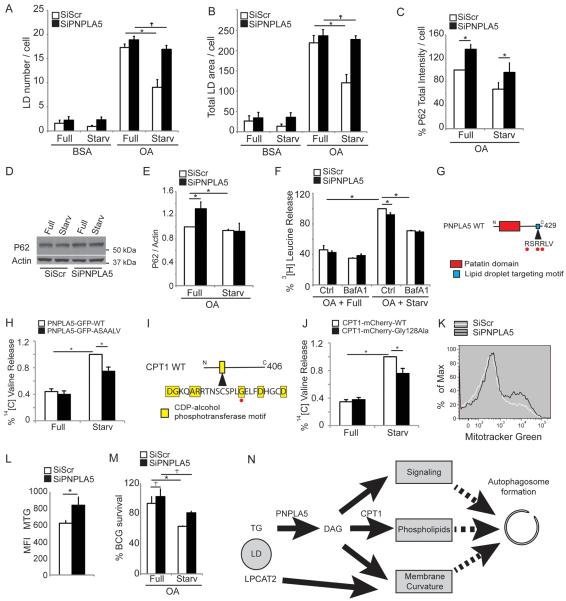
Figure. 7. PNPLA5 is required for efficient autophagy of diverse substrates.
(A,B) HeLa cells were transfected twice with PNPLA5 or scramble (Scr) siRNA control, treated for 20 h with BSA or with 500 μM BSA-Oleic Acid (OA) and starved (Starv) or not (Full) for 2 h, lipid droplets stained with Bodipy 493/503 (illustrated in Figure S6) and quontified by high content imaging acquisition and analysis. (C–E) HeLa cells transfected and treated as in A; total immunofluorescence intensity of endogenous p62 was quantified in GFP-positive cells by high content image acquisition and analysis (C). (D,E) p62/actin ratios determined by immunoblotting and densitometry. (F) Proteolysis of proteins in HeLa cells. HeLa transfected and treated as in A, in media containing [3H] leucine, were starved or not with or without Bafilomycin A1 (Baf) for 90 min. Leucine release was calculated from radioactivity in the tricarboxylic acid-soluble form relative to total cell radioactivity. (G) Lipid droplet targeting motif of PNPLA5, Red dots, residues that have been mutated to Ala (RSRRLV changed to ASAALV). (H) Proteolysis of long-lived proteins in HeLa cels were transfected with plasmids expressing wild-type (WT) GFP-tagged or ASAALV PNPLA5 proteins and treated 20 h with 500 μM BSA-Oleic Acid (OA) in media containing [14C] valine. Y-axis, valine release from stable proteins. (I) CDP-alcohol phosphotransferase catalytic motif in CPT1. Red dot, Cys-to-Ala mutation. (J) HeLa cells were transfected with plasmids expressing wild-type (WT) mCherry-tagged or CPT1Gly128Ala mutant CPT1 proteins and processed for proteolysis of long-lived proteins as in (H). (K,L) Flow cytometry analysis of cellular mitochondrial content. HeLa were treated as in A (full medium) and stained with MitoTracker Green. (K) histograms; (L) average mean fluorescence intensity (MFI) of MitoTracker Green per cell. Data, means ± s.e. (n≥3); *, p<0.05. (M) Analysis of the role of PNPLA5 in autophagic killing of BCG. RAW 264.7 macrophages were transfected twice with PNPLA5 siRNAs or scramble (Scr) control. Cells were then treated 20 h with 250 μM BSA-Oleic Acid (OA) and infected the day after with BCG. Autophagy was induced 4 h by starvation (Starv). BCG survival, % of control BCG CFU. Data, means ± s.e.m. *, p<0.05. (N) Model for how lipid droplets contribute to autophagosome biogenesis (see discussion).

