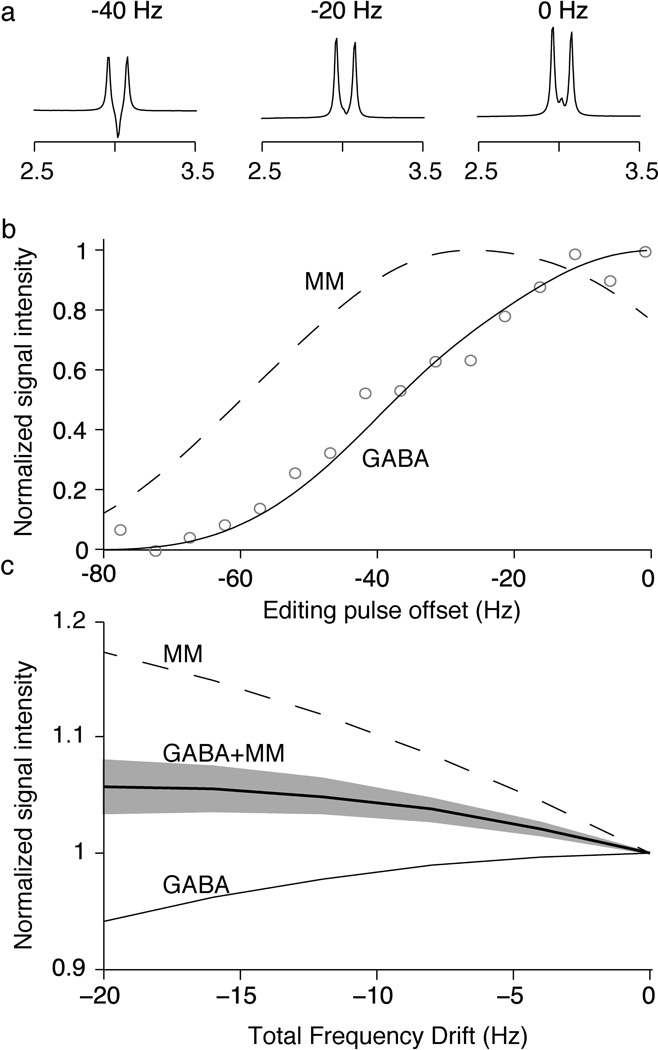
Figure 3.
Editing efficiency simulations. (a) Simulated spectra for a range of discrete editing frequency offsets. As the 1.9 ppm peak is shifted off resonance from the inversion pulse, the shape of 3.0 ppm GABA peak is altered. (b) Relative integrals of the simulated peaks for both GABA (solid line) and MM (dashed line), for a range of editing pulse offsets. GABA phantom data from a previous study (41) is shown in grey circles to demonstrate agreement between the simulations and experimental data. (c) Simulated integral of the 3.0 ppm GABA peak (solid line) and the MM peak (dashed line) as a function of frequency drift occurring throughout the experiment, normalized to the signals at 0 Hz offset. The net impact of frequency drift on the GABA and MM peaks for quantified GABA+ is shown as a thick line assuming 50:50 signal contributions for GABA and MM and as a shaded area for the range of 40:60 to 60:40 signal contributions for GABA and MM at zero drift.

