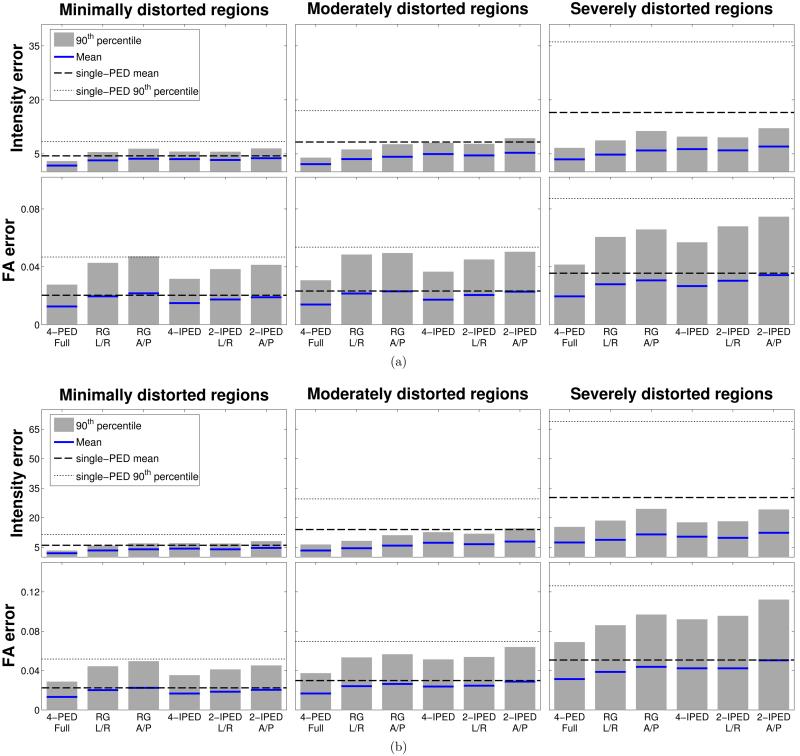
Figure 6.
Quantitative performance of different methods (measured separately for groups of voxels that experience different amounts of local image distortion) for simulated data with (a) small and (b) large distortion in comparison to the ground truth images. The height of each bar plot shows the 90th percentile of the computed error measure for each region, while the solid blue line shows the mean value of the error measure. The thin and thick dashed lines correspond to the 90th percentile and the mean, respectively, of the error measure in the region for the single-PED methods (all single-PED methods had similar error numbers, and we show the average value of the four).

