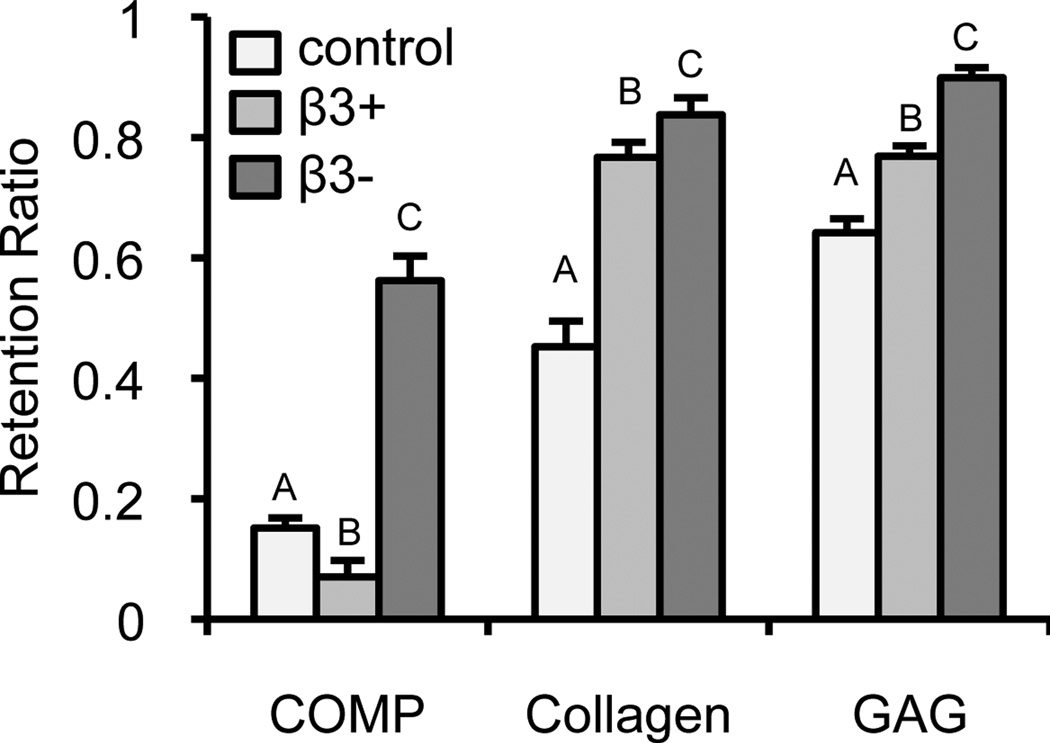
Figure 5.
Retention ratio of the matrix constituents COMP, collagen, and GAG for each of the TGF-β3 culture treatments: control (light), β3+ (medium), and β3− (dark). Upper case letters denote groups of significance (p < 0.05); thus for each matrix constituent: groups with different capital letters were statistically different.

