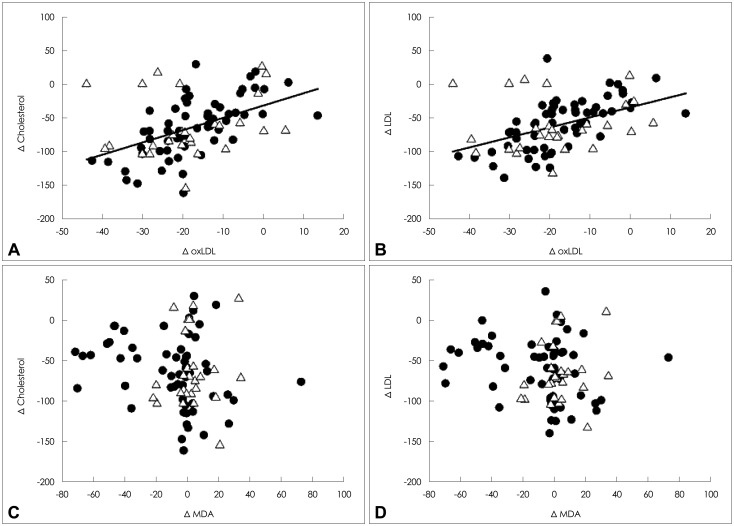
Fig. 3.
Correlation between changes in the levels of lipids and markers of oxidative stress. Black circle and white triangle signify acute and chronic stroke patients, respectively. Individual values and linear regression lines are displayed. LDL: low-density lipoprotein, MDA: malondialdehyde, oxLDL: oxidized low-density lipoprotein.

