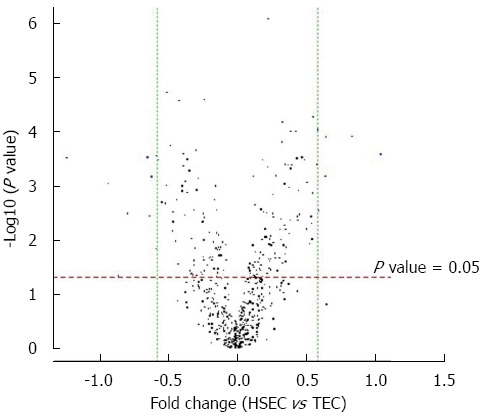
Figure 3.

Volcano plot of sample hepatic sinusoidal endothelial cells vs tumor endothelial cells. Standard selection criteria to identify differentially expressed genes are established at |Fold change| ≥ 0.585 and P value < 0.05 (Blue dot in figure). TEC: Tumor endothelial cell; HSEC: Hepatic sinusoidal endothelial cell.
