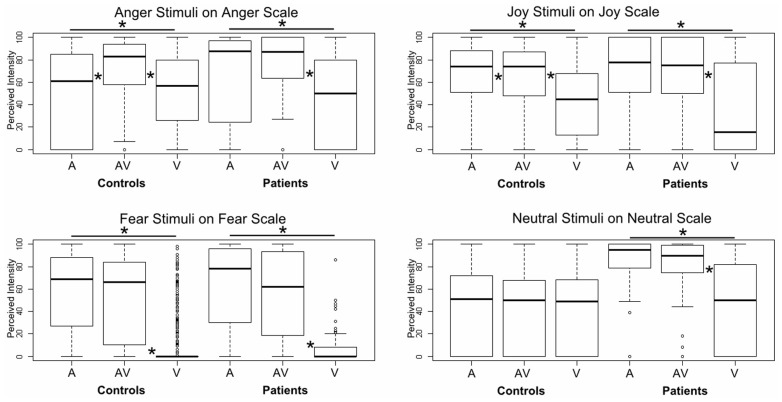
FIGURE 3.
Boxplot of GLM results for intensity ratings of each emotion on the corresponding target scale. Each box corresponds to a specific modality (A: auditory, AV: audiovisual, V: visual) and a specific group (patients vs. controls). The difference between A and AV for the controls is almost invisible, as zero values data were included in the plot. *Indicates a significant difference between modalities (pairwise).

