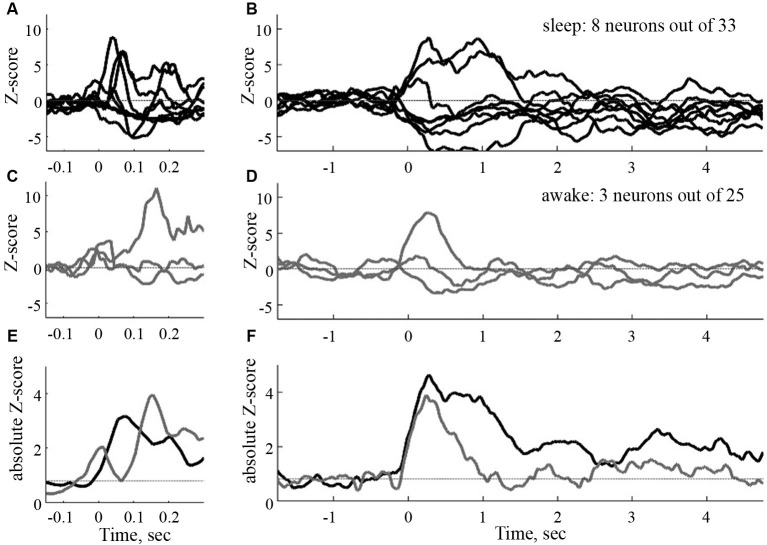
Figure 3.
Time courses of the sound evoked post stimulus histograms in the CA1 of the hippocampus of the rat. To the left, normalized filtered post stimulus time histograms (PSTHs) at a short time scale (window 50 ms). To the right, same responses at a large time scale (window size 500 ms). Black curves: sleep, gray curves: awake. (E) and (F): absolute mean rates in the two conditions (from Vinnik et al., 2012).

