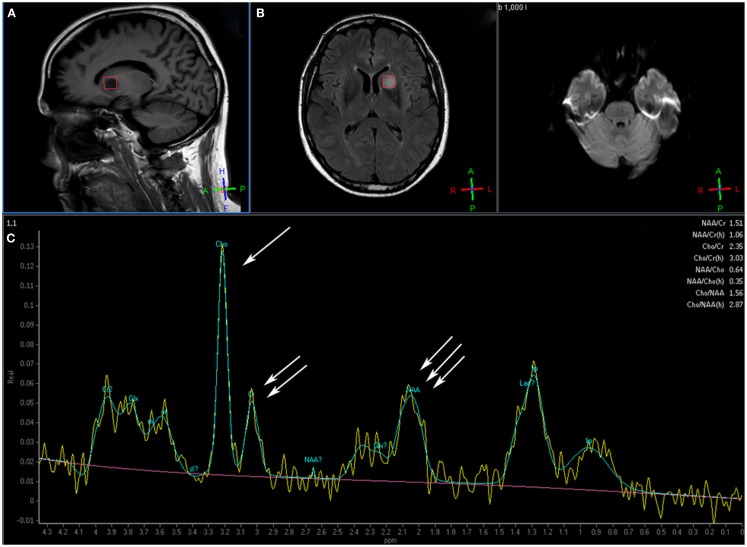
Figure 1.
This patient with a glioblastoma multiforme shows the voxel over the area of interest in the tumor over the sagittal T1 (A) and axial FLAIR (B) image. Magnetic resonance spectroscopy (C) shows an elevated choline peak (single arrow) and decreased creatine (double arrow) and N-acetyl aspartate (NAA) peaks (triple arrow), which is the typical pattern for tumor (Images courtesy of Dr. Ashok Srinivasan, University of Michigan).

