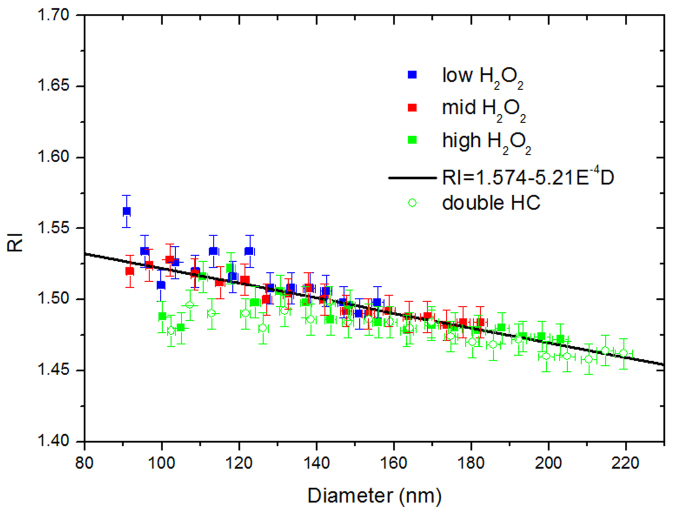
Figure 5. Dependence of the RI values on the surface mean diameter of the ethylbenzene SOA generated in the L3–L6 experiments.
The solid data points represent the L3–L5 experiments with different concentrations of hydrogen peroxide, whereas the green (solid and open) data points represent the L5 and L6 experiments with different hydrocarbon concentrations.

