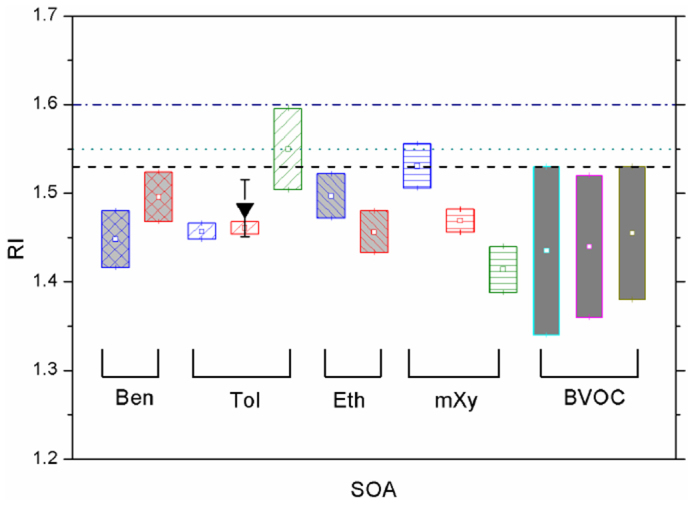
Figure 6. RIs of the different SOA particles, and the comparison between the experimental data and the model values.

The BTEX data are the current results; the toluene result (inverted triangle) is from Nakayama et al.20, and the data of the BVOCs are from Kim et al.25,26,27. The blue boxes are the results of the low-NOx experiments; the red boxes are the results of the classical high-NOx experiments, and the green boxes are the results of the HONO experiments. The three BVOCs are limonene (cyan), α-pinene (pink) and β-pinene (dark yellow). The three lines are the RI values of organic aerosols in different models: the blue dash/dot line is for the ULAQ; the green dotted line is for MIRAGE; and the black dashed line is for ECHAM4, GOCART, GISS, Sprintars and Grantour51.
