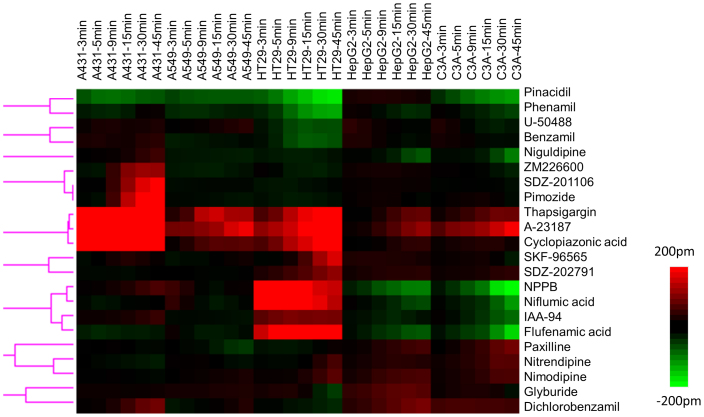
Figure 1. DMR heat map of ion channel ligands active in five cell lines, A431, A549, HT29, HepG2, and C3A.
This heat map was obtained using clustering analysis of the DMR profiles of the ion channel ligands in the five cell lines. For each ligand, the real responses at six discrete time points post-stimulation (3, 5, 9, 15, 30, 45 min) in each cell line were used for the cluster analysis. Only ligands that led to a DMR greater than 50 pm, or less than −50 pm in at least one cell line were included in this analysis.

