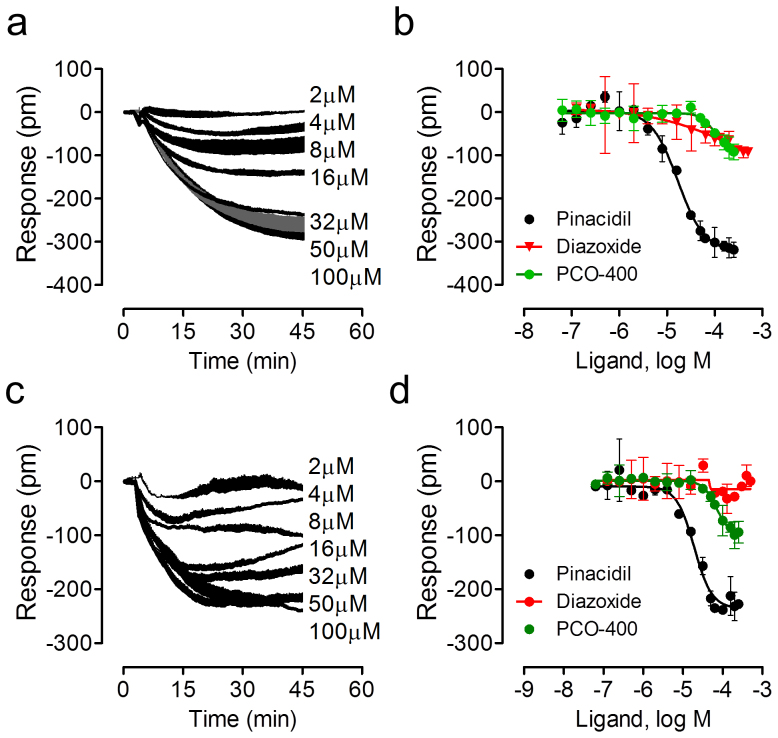
Figure 3. Dose responses of KATP openers in C3A and A549 cells.
(a) The real-time DMR dose responses of pinacidil in C3A cells. (b) The real DMR amplitudes at 50 min post stimulation as a function of ligand dose in C3A cells. (c) The real-time DMR dose responses of pinacidil in A549 cells. (b) The real DMR amplitudes at 50 min post stimulation as a function of ligand dose in A549 cells. Data represents mean ± s.d. (n = 6 for pinacidil, and n = 3 for other openers).

