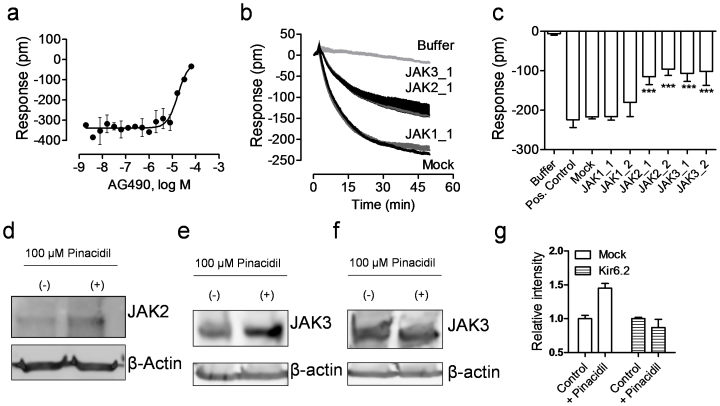
Figure 7. JAK2 and JAK3 were involved in the KATP signaling in C3A cells.
(a) The DMR amplitudes of 40 μM pinacidil at 50 min post stimulation as a function of AG490 dose. The cells were treated with AG490 for 1 hr, followed by pinacidil stimulation. (b) The real-time DMR of 40 μM pinacidil in C3A cells with mock transfection (mock) or JAK siRNA. The buffer DMR was included as a negative control. (c) The pinacidil DMR amplitudes at 50 min post stimulation as a function of treatment. (d) Western blot using anti-JAK2 for cell lysate without (−) and with (+) 100 μM pinacidil treatment. (e) Western blot using anti-JAK3 for the lysate of mock transfected cells without (−) and with (+) 100 μM pinacidil treatment. (f) Western blot using anti-JAK3 for the lysate of the Kir6.2 siRNA treated cells without (−) and with (+) 100 μM pinacidil treatment. (g) The relative intensity of JAK3 protein in the mock transfected or the Kir6.2 siRNA treated cells without (Control) and with 100 μM pinacidil treatment (+Pinacidil). Data represents mean ± s.d. (n = 6 for a–c; n = 3 for g).

