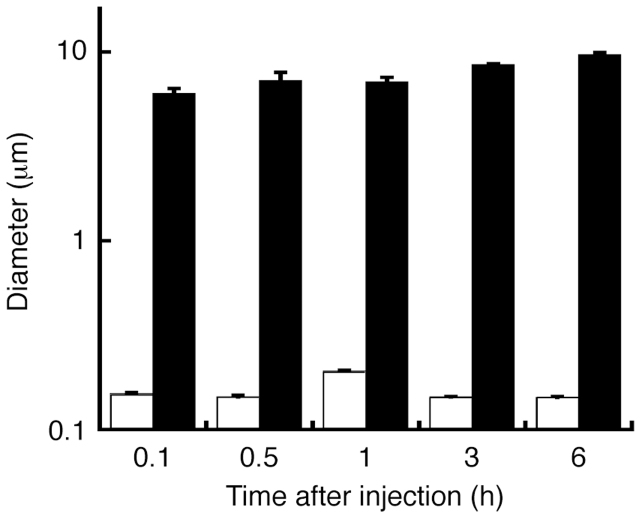
Figure 2. Time-dependent DLS analysis of TPFE–siRNA.
The change in size was monitored after injection of the TPFE–siRNA complex into PBS buffer without mouse serum (white) or into PBS buffer containing mouse serum (black). The TPFE–siRNA complex agglutinated in the serum. Error bars indicate ±SD (N = 3 for each group).

