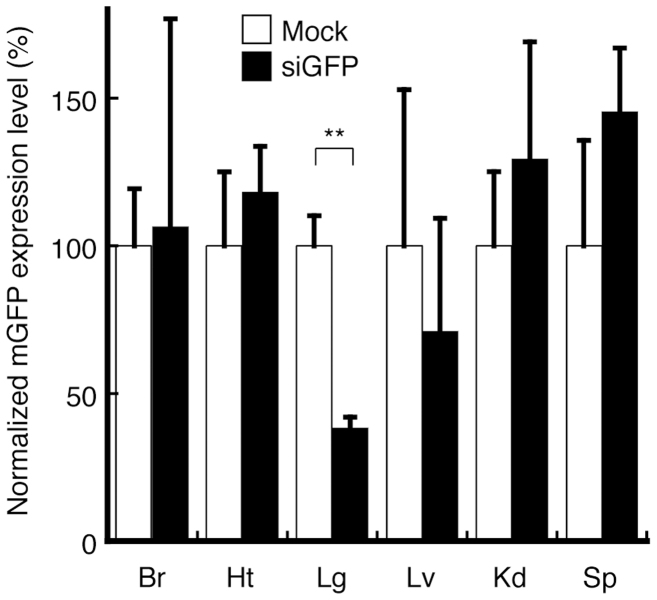
Figure 3. In vivo biodistribution of injected siRNA in each organ.
At 24 h after the injection of TPFE–siRNA complexes, knockdown of mRNA expression of EGFP was detected by real-time RT-PCR. (N = 4 for each group). Black and white bars indicate the siGFP and siNEG as a negative control, respectively. Error bars are SEM. ** P < 0.005 versus siNEG-injected group. Abbreviations: Br, brain; Ht, heart; Lg, lung; Lv, liver; Kd, kidney; Sp, spleen.

