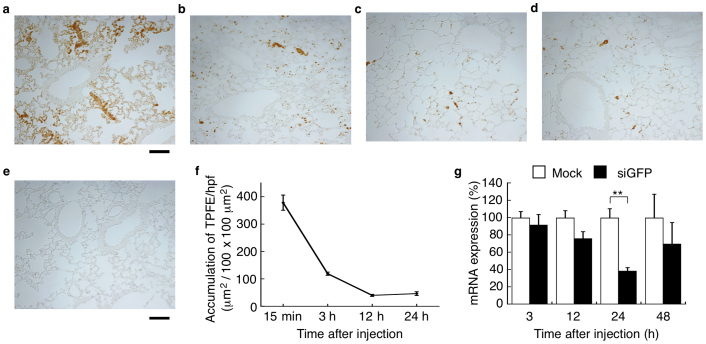
Figure 5. Time course of accumulation of TPFE and RNAi activity in mouse lung.
(a–d) Histological appearance of TPFE in mouse lungs sacrificed at 15 min (a), 3 h (b), 12 h (c), and 24 h (d) after injection of TPFE–siRNA complexes. Brownish-orange colored area indicates the color of TPFE. Scale bars are 100 μm. (e) Histological appearance of unstained lung sections at 3 h after injection of saline. Scale bar is 100 μm. (f) Time-dependent TPFE accumulation determined by histology (N = 3). (g) RNAi activities of siGFP and scrambled siRNA are shown in black and white bars, respectively (N = 4 for 3, 12 and 24 h, N = 6 for 48 h). Error bars are SEM. ** P < 0.005 versus scrambled siRNA-injected group.

