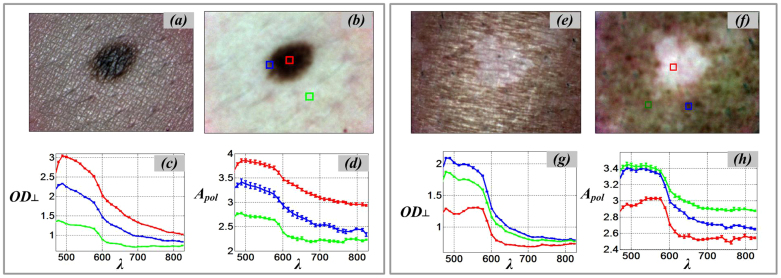
Figure 1. SkinSpect skin images and spectra of melanocytic nevus and vitiligo.
(a) parallel-polarized color image of skin with nevus; (b) cross-polarized color image of skin with nevus; (c) Cross polarized optical density spectra, OD⊥, of nevus core (red), nevus halo (blue), and normal skin (green), (d) Polarized attenuation spectra, Apol, of nevus core, nevus halo, and normal skin; (e) parallel-polarized color image of skin with vitiligo; (f) cross-polarized color image of skin with vitiligo (g) Cross polarized optical density spectra, OD⊥, of vitiligo (red) and normal skin (blue and green), (h) Polarized attenuation spectra, Apol, of vitiligo and normal skin.

