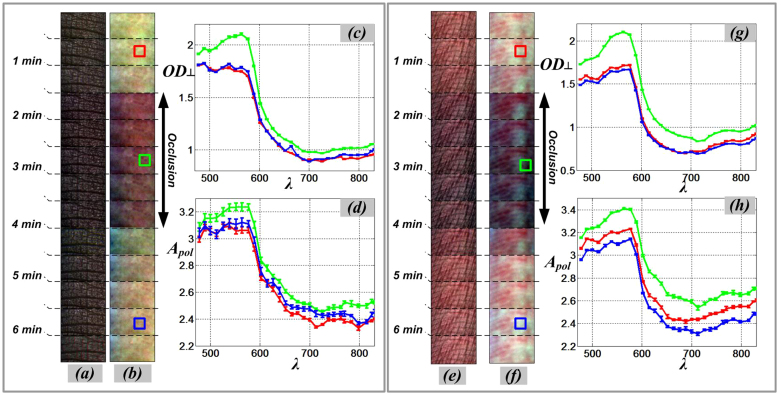
Figure 2. SkinSpect skin images (time sequence) and spectra of same anatomical region of interest during venous occlusion.
(a) Color parallel-polarized image sequence and (b) Color cross-polarized image sequence of dorsal-side finger; (c) Cross polarized optical density spectra, OD⊥, and (d) Polarized Attenuation spectra, Apol, of dorsal-side finger; (e) Color parallel-polarized image and (f) Color cross-polarized image of volar-side finger; (g) Cross polarized optical density spectra, OD⊥, and (h) Polarized Attenuation spectra, Apol, of volar-side finger. (Red line: pre-occlusion, green line: during occlusion, blue line: post-occlusion).

